Shared insights and performance comparisons
With your Contractor Scorecard, you have near real-time information on your Speed, Quality, Price and Engagement scores for
each customer
. You can see the specific factors contributing to your scores so you know just where to focus to stay on top.
From the Benchmarking tab, you and your customers can also see how your performance compares not just to all other service providers, but to your true peers –
the service providers in your specific trade and area of service
doing comparable repairs for customers in the same industry.
Get the answers you need to succeed
- How does our performance compare to all other providers on ServiceChannel?
- How are we trending?
- What are our competitive strengths and how can we build on those?
- Are there challenges with our service for specific customers or types of customers that we need to address – or help them address so we can provide our best service?
- Do any of our technicians need extra training or coaching?
- Which actions should we prioritize for the biggest impact?
Your scorecard puts the answers at your fingertips. You get a complete view of your performance over time, from a high-level view of your scores across all your customers, down to each individual customer.
You can refine and deepen your insights by filtering on specific customer(s), customer location IDs, trade, industry, work order priority, geographic area, and date range.
See how you're doing on each of the key performance indicators (KPIs) that factor into your scores and which ones are having the biggest impact – even drill down to the related work orders and invoices.
Relevant, updated metrics to boost your profitability and growth
Your Contractor Scorecard is built with metrics and calculations based on the latest ServiceChannel technology and ever-expanding knowledge base. It delivers accurate, meaningful business insights and the fair assessments you and your customers expect.
It gives you the same easy access to the insights your customers have about you, enabling more productive negotiations and a stronger partnership. It helps you identify opportunities to improve your service and boost your efficiency and profitability at the same time.
The scorecard calculations align with ServiceChannel Provider Search algorithms. By using it effectively to monitor and improve your scores, you can also boost your exposure to top multi-location brands and win new customers.
How it works
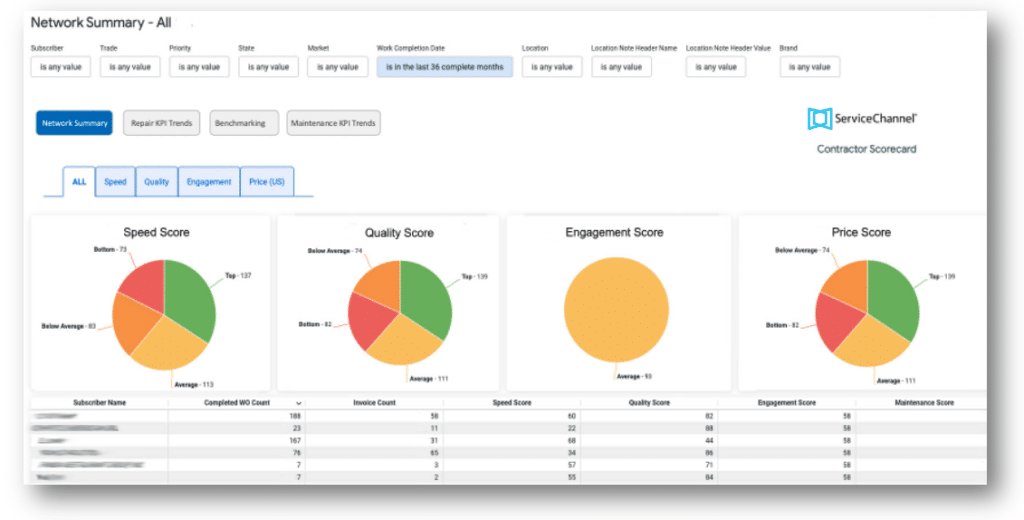
When you log into ServiceChannel, simply click on the scorecard tab at the top of any page or on the "Improve My Scores" button on your provider homepage to access your scorecard.
See your scores by customer, how you stack up
The Score Summary tab shows how your scores for customers compare to all provider scores on the platform. Below that are your scores for your individual customers.
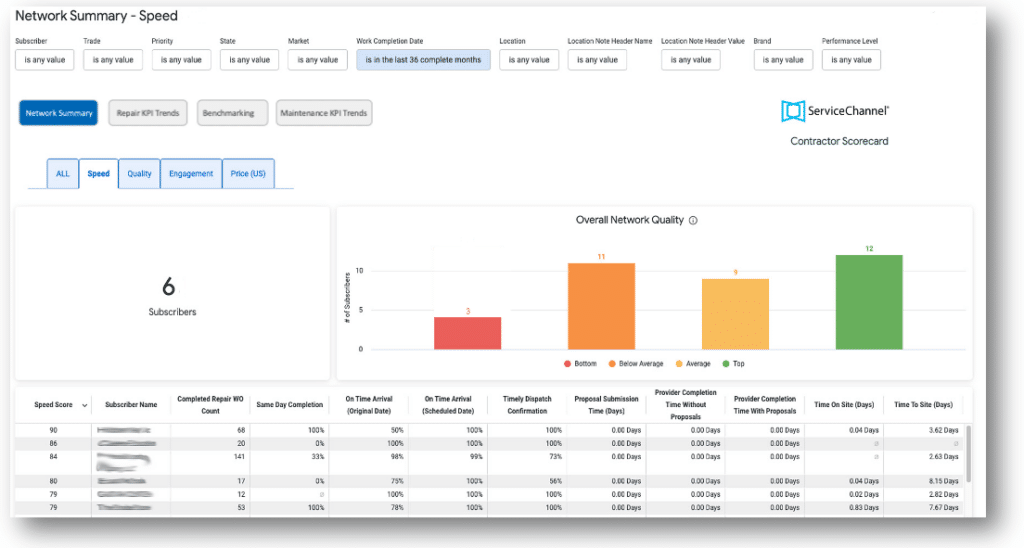
- See at a glance how your scores for Speed, Quality, Engagement and Price generally stack up against the thousands of providers on ServiceChannel: Top, Average, Below Average, and Bottom.
- See a list of your customers and your scores for each one. You can further refine this list by trade, work order priority, location, and date range.
- Just click the Speed, Quality, Engagement or Price tabs, or any score in the list, to see details about that score.
- Click the Benchmarking tab to see how your performance compares to your peers – other service providers in your specific trade and geographic area of service, working for customers in the same industry.
See where you stand on the metric contributing to each score
The Speed, Quality, Engagement and Price tabs show where your scores fall into each performance bucket, along with your scores and KPIs for each customer
- From the Speed, Quality, Engagement and Price tabs, you can see how your scores are distributed across the Top, Average, Below Average and Bottom performance buckets. Click on any bucket to see the related customers.
- For any given customer, you can see how you're doing on all of the individual key performance indicators (KPIs) that make up that score.
- Click on any score in the Speed and Quality tabs to see the related work orders (or invoices in the Price tab).
See how you're trending
The "Repair KPI Trends" tabs for Speed, Quality, Price and Engagement show how your score and contributing KPIs are changing over time.
- Click the "Repair KPI Trends" tab to see where you stand now on a specific score and on each contributing KPI, and how these metrics are changing over the timeframe you specify.
- By default, you see these metrics as an average over all your customers. Filter to see the metrics for a specific customer or group of customers.
- Click on any point in the timeline in the Speed and Quality tabs to see all related work orders (or invoices for Price).
What your customers see
Your customer sees the same view for all their providers that you have for all your customers, with many of the same filters.
Shared insights for stronger partnerships
In their version of the Contractor Scorecard, your customers have the same views of data on all their providers as you have for all your customers. That means you and your customer see the same data on the work you do for them, with the same ability to drill down to the details.
Use these mutually shared insights to strengthen your partnership and make your regular performance reviews more productive. Armed with the same data, you can take a proactive role in resolving differences in your perspectives and focus on improvements
you
can make, as well as improvements
your customer
can make to help you do your best work.
For example, in drilling down on your below average scores and KPIs for Price, you might both see that the invoices driving that low score are mostly emergency work orders. This insight may help your customer balance your price score with the realization that you reliably deliver exceptionally fast, high-quality work for those critical situations where they need it most. Or they may recognize that both parties would benefit from a reasonable adjustment to how they assign work order priority.
More on scores
How performance scores can help you improve service and efficiency, get paid faster, and get discovered by new customers.
See how your scores stack up compared to providers in your own trades and service area.
See how your scores are calculated and what defines top performers based on current market conditions.
Follow these best practices to provide great service and get discovered by new customers in Provider Search.
FAQs
FAQs
How are scores calculated?
ServiceChannel calculates provider performance scores for Speed, Quality, Price and Engagement using more than 25 objective key performance indicators (KPIs) based on actual work order data. The exact formulas used to calculate each score are proprietary and evolve over time based on data from millions of work orders for thousands of customer locations. The scores fall into one of four "quartiles" compared to the average scores of other providers on ServiceChannel: Top, Average, Below Average, and Bottom. The threshold scores that define the quartiles are based on current market conditions and differ for each score. For more details on how scoring works, including the specific KPIs that go into each score and the current threshold scores that define each quartile, see